
AERIS
| Projets | Couverture temporelle | Param. | Fichiers | Visu. | Statut | Stats |
|---|---|---|---|---|---|---|
| RADARS-MF | ||||||
| METEO-FRANCE, RADAR COMEPHORE Hourly Precipitation Amount Composite | 2007 –> | Precipitation | concaténation ~720 -> 1 nc/mois | 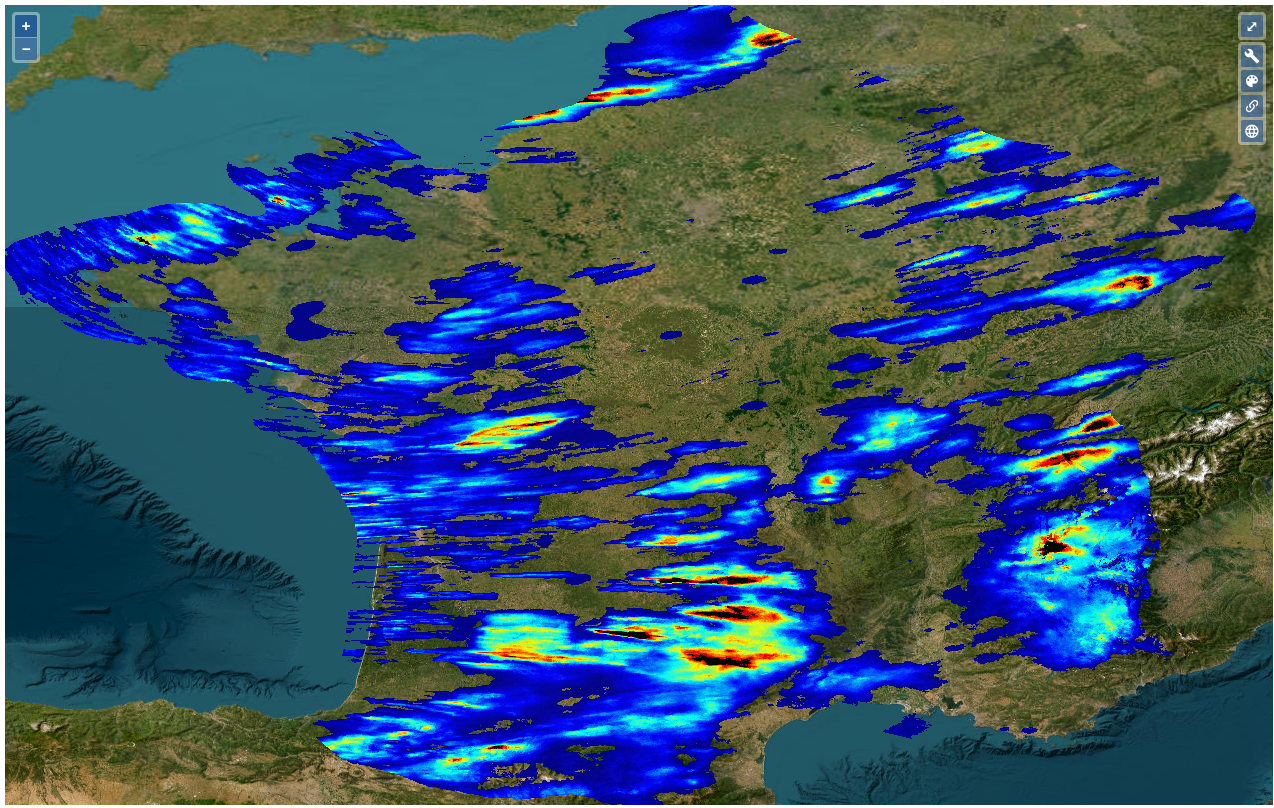 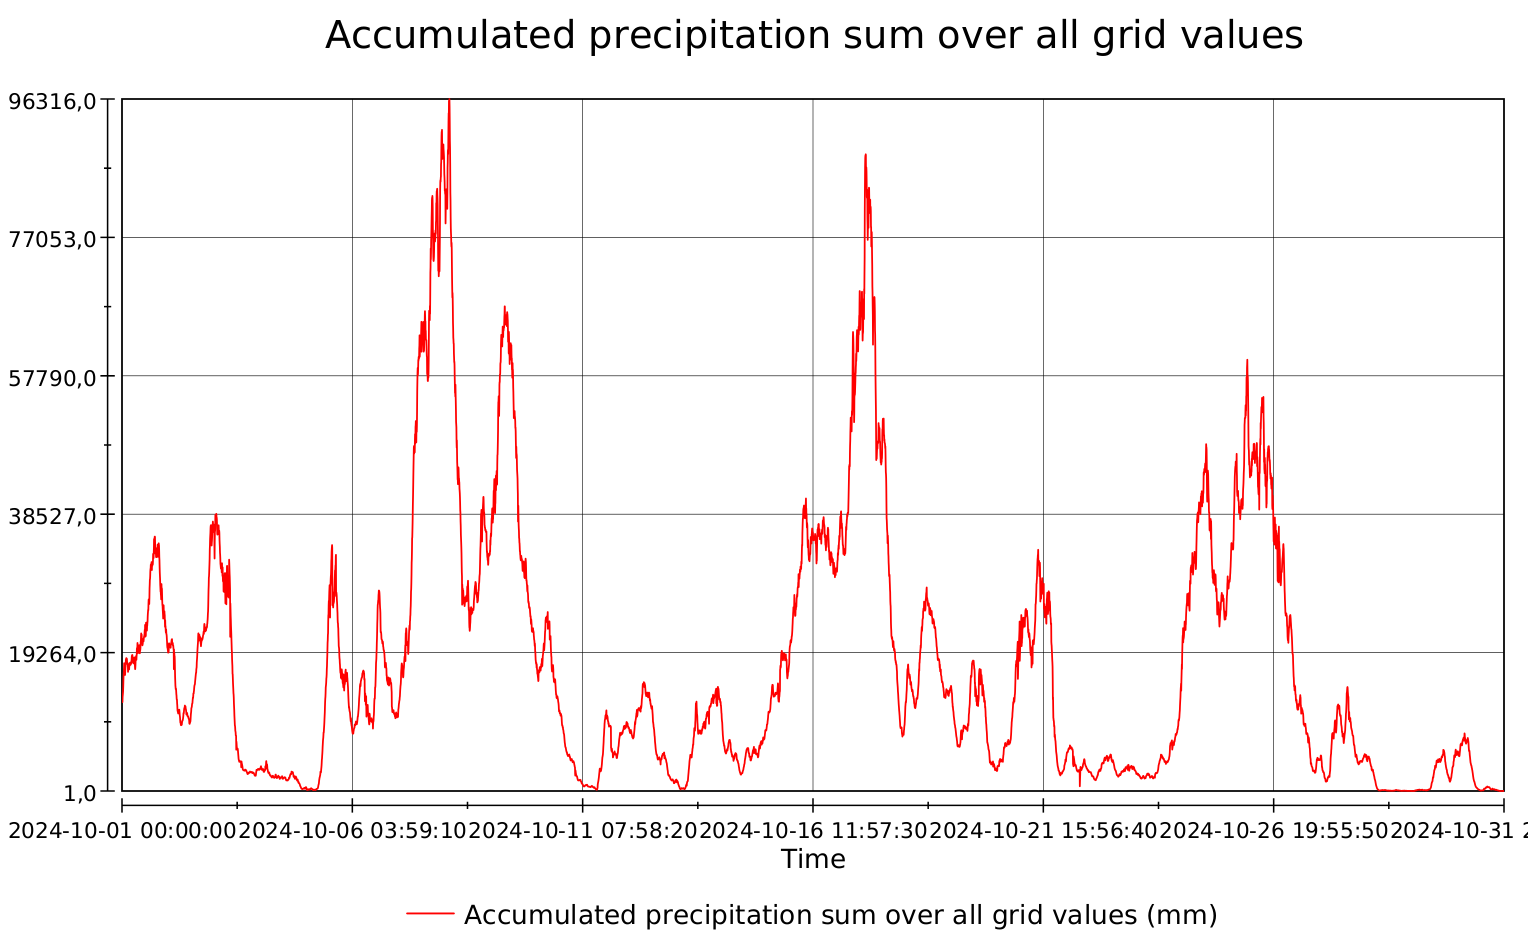 |  | |
| METEO-FRANCE, RADAR 5min Precipitation Amount Composite. | 2007 –> | Precipitation | formatage concaténation ~8000 -> 1 nc/mois voir détails | 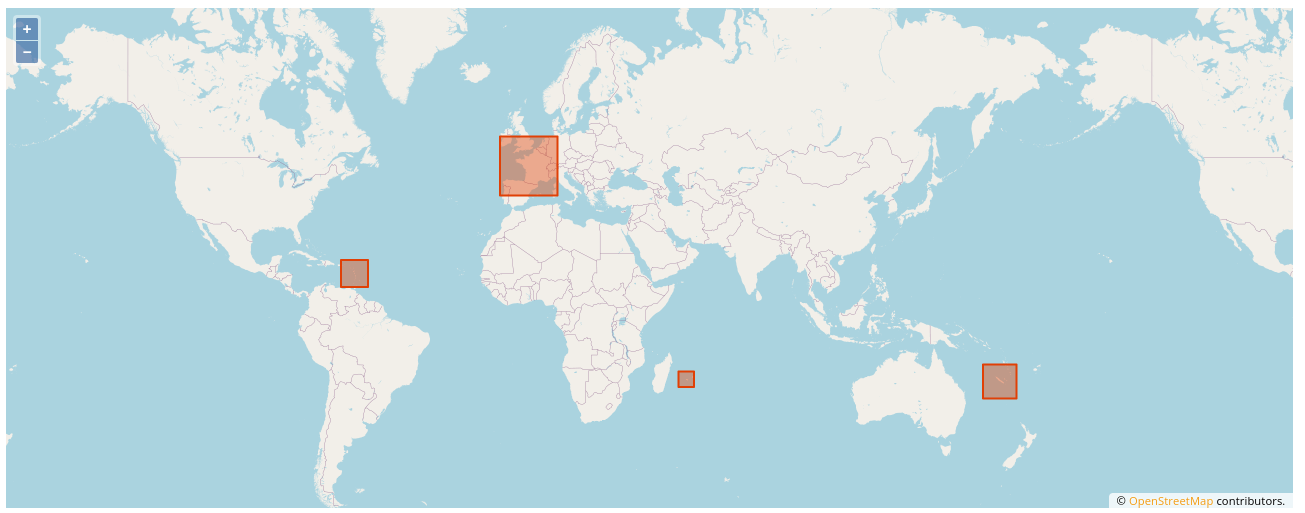 | Sélec0 par Région | |
| IASI-SOFRID | 2023: 7 2024: 4 2025: 2 | |||||
| IASI SOFRID CO/O3 [2] | 2008-2020 | 39 param | concaténation compression 365 -> 1 nc /an 48 -> 21 Go | 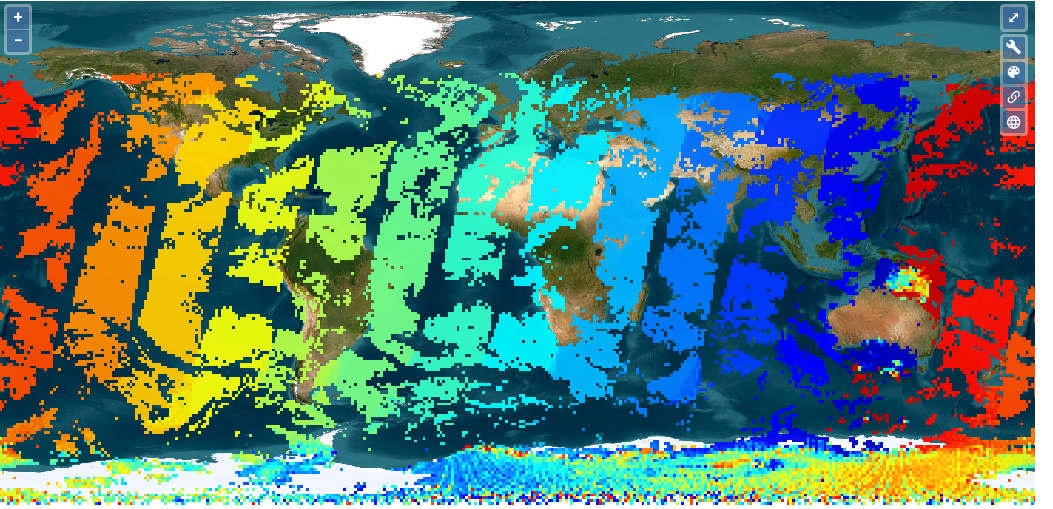 |   | |
| IASI SOFRID CO/O3 Monthly means [2] | 2008-2020 | 39 param. | concaténation compression 12 -> 1 nc/an 6.8 -> 4.3 Go | 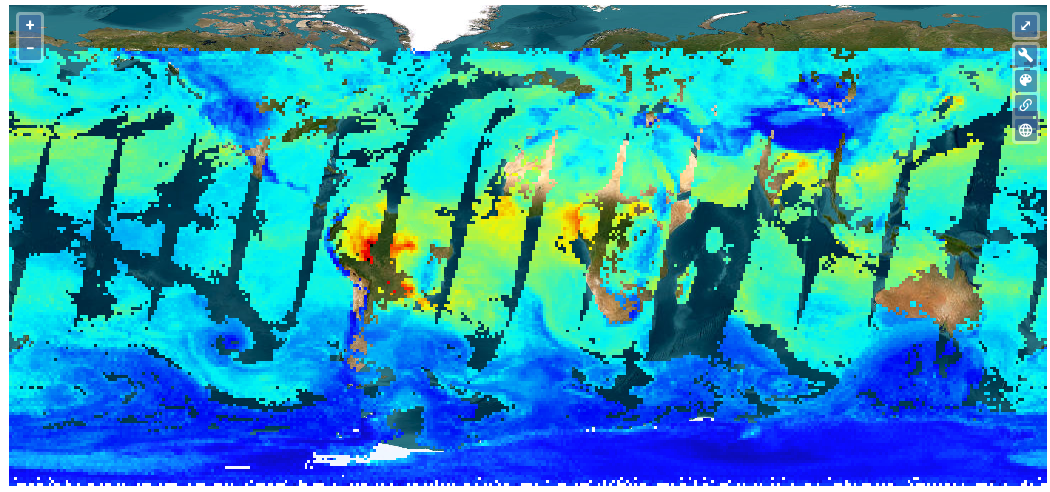 | | |
| MISTRALS | ||||||
| Surface Fluxes for the NW Med | 2012-2013 | Evap. Precip. Wind Heat Radiation… (10) | concaténation + netCDF4 compressé attribaux globaux + standard_name 30/mois -> 1 nc/an 9 -> 3 Go | 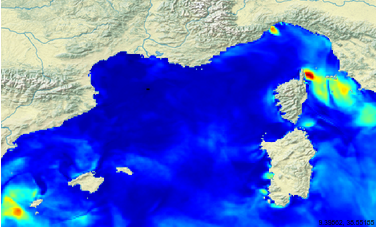 | -> IPSL | |
| SAFIRE+ [358] | Regrouper les fiches | |||||
| – Australie & Nouvelle Zelande – Europe [Eastern, Northern, Western, Southern] – Norther America – Latin America – North Africa – Sub Sahara | 1992 –> | Ozone GHG Trace gases | -1 nc par vol -1 ou plusieurs vols par jour | 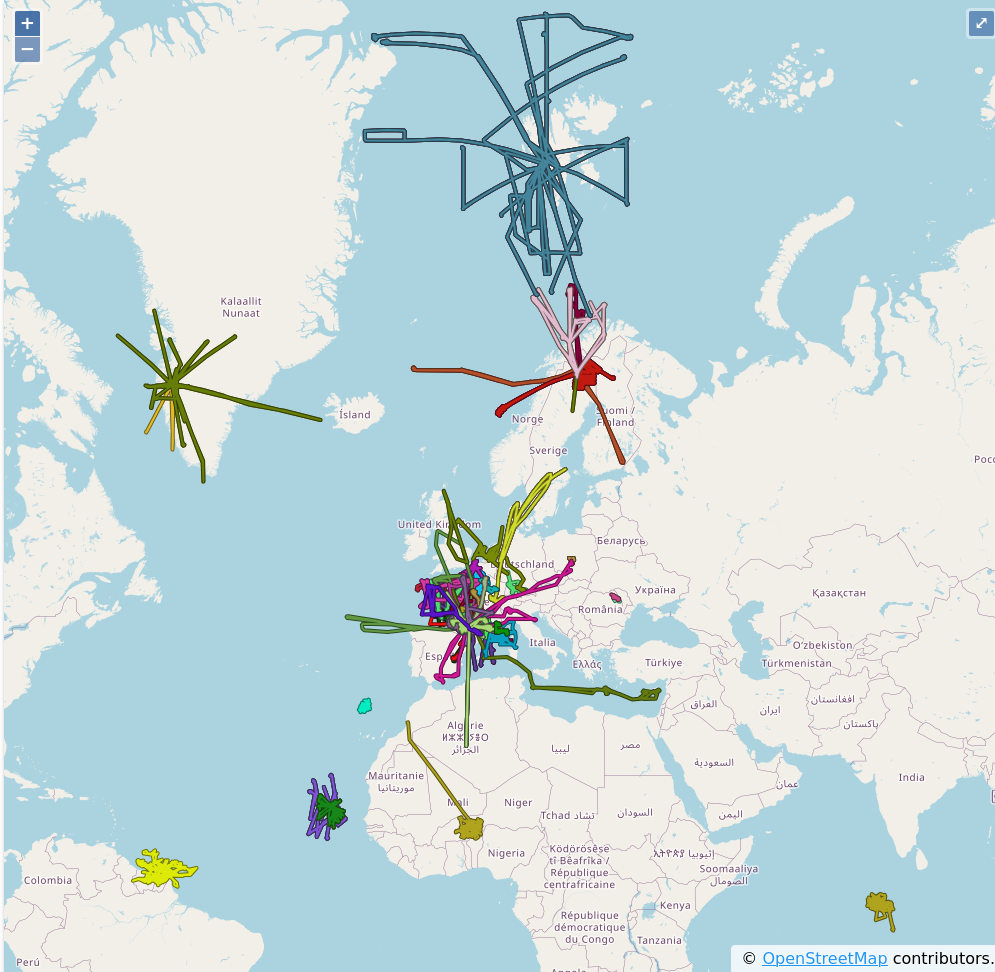 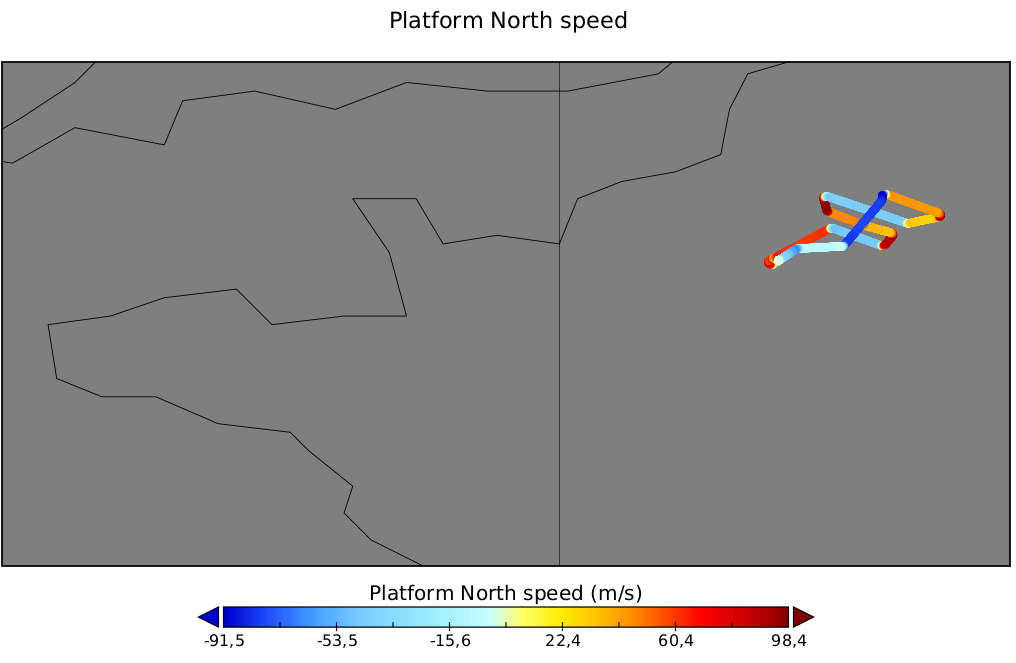 | Trajectory | |
| P2OA [60] | ~2Go | Regrouper les fiches | 2024:31 2025:40 | |||
| cra_60mtowerslow_l0_20250701_20251009 [4] | 2015 –> | Rain, Wind, Baro, Humidity, Temp…. | ~7000 ASCII,jpeg | 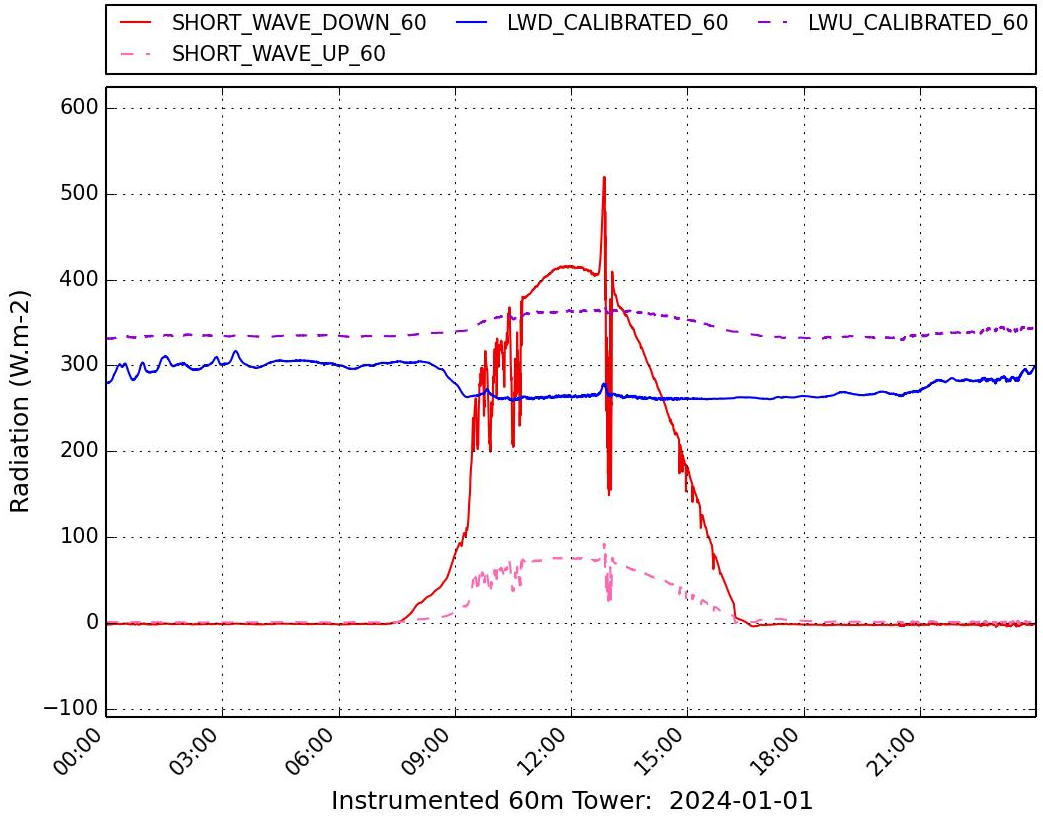 | ASCII ->nc | |
| pdm_pyranometer_l2a_20190522_20251008 | 2014 –> | Solar irradiance | ~4000 ASCII,jpeg | 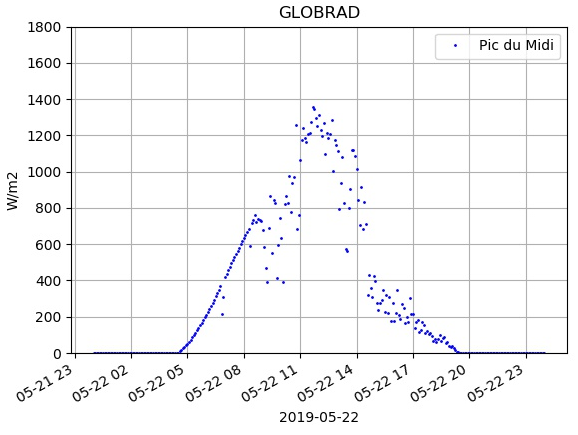 | ASCII ->nc | |
| Ceilometer – P2OA-CRA station – L1A | 2022 –> | Cloud base altitude | concatenation compression ~2600 -> 1 nc 1.7 -> 1.3 Go | |||
| Carbon monoxide (CO) mole fraction (CRDS) – P2OA-CRA station – L2A [7] | 2019 –> | Carbon monoxide mole fraction | ~ 3300 ASCII,jpeg | 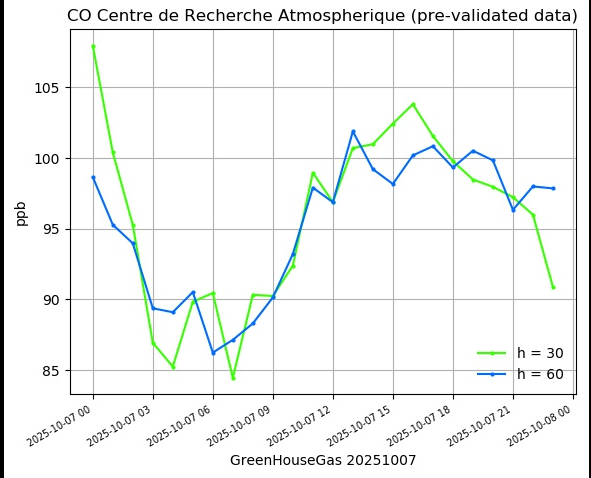 | ASCII ->nc | |
| Ozone (O3) mole fraction (UV analyzer) – P2OA-PDM station – L2A | 2005 –> | Ozone mole fraction | ~ 7200 ASCII,jpeg | 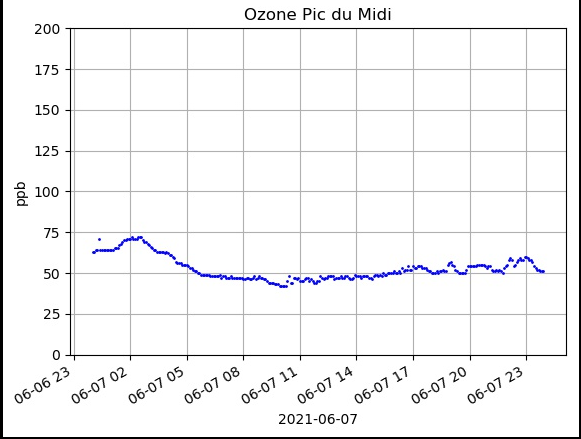 | ASCII ->nc | |
| SAETTA | 2014 -> 2024 | Lightning Mapping | ~10000 ASCII | catalogue dédié pour 2 fiches ?? | ASCII ->nc | 2023: 2 2024:24 2025:16 |
| SNO-IFA [143] | 2009 -> 2022 | GHG Mole Fractions | Regrouper les fiches HTTP .zip (fichiers ASCII) .nc (1 fichier nc) | 2025:3 | ||
| HAMSTRAD | 2009-> 2024 | Temperature Humidité Liquid water path Integrated water vapor | 15×4 ASCII -> 15 Nc 31 Go -> 330 Mo | 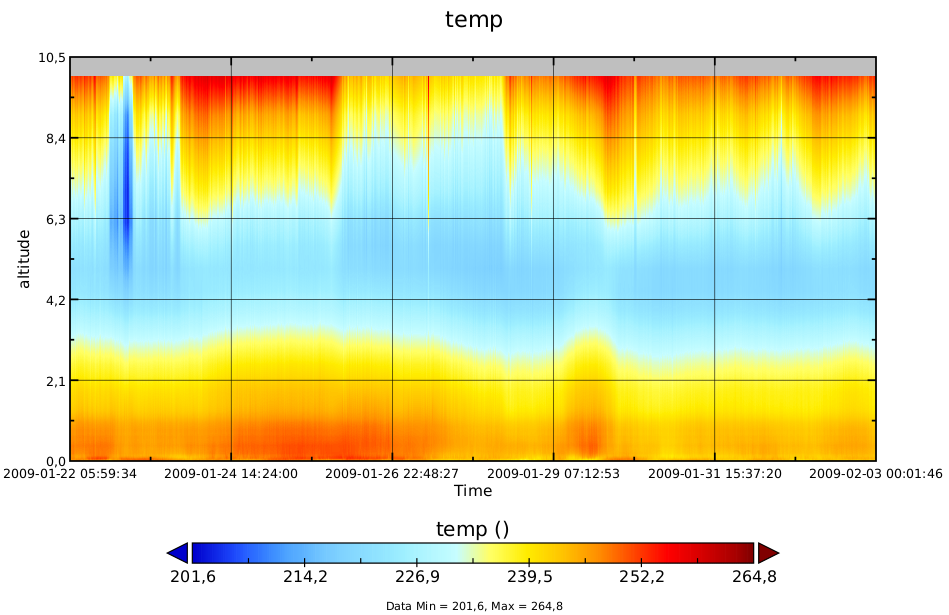 | ASCII ->nc |
ODATIS
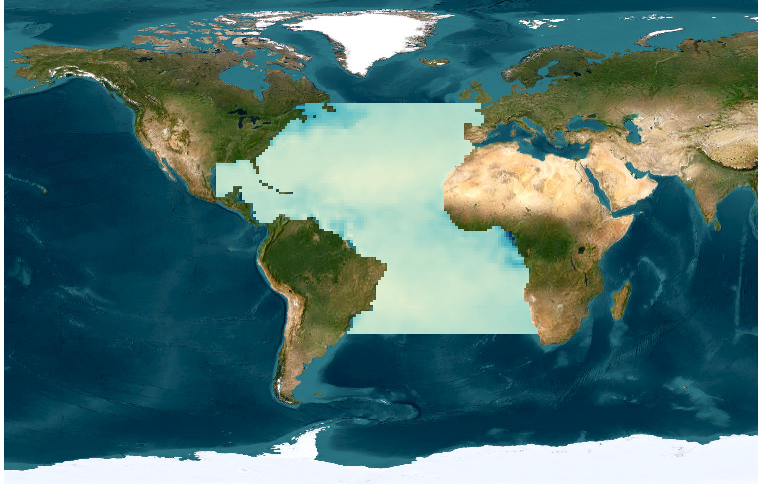
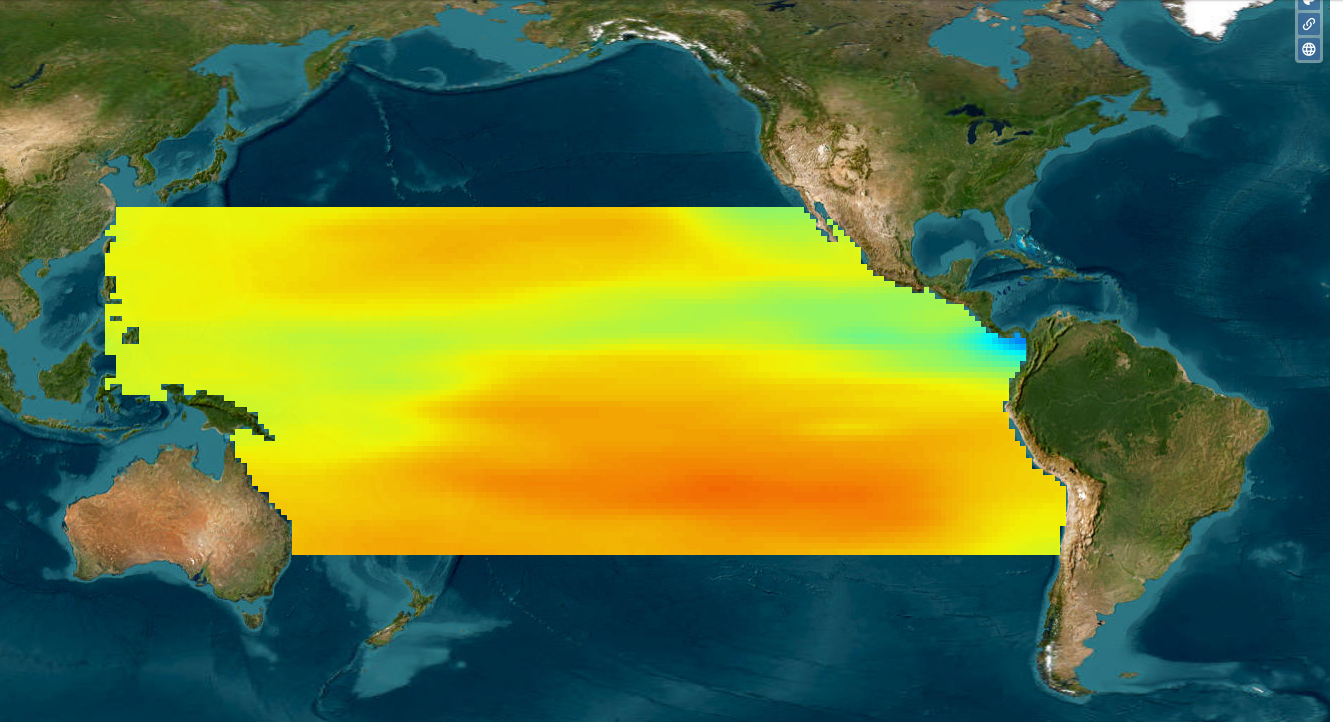
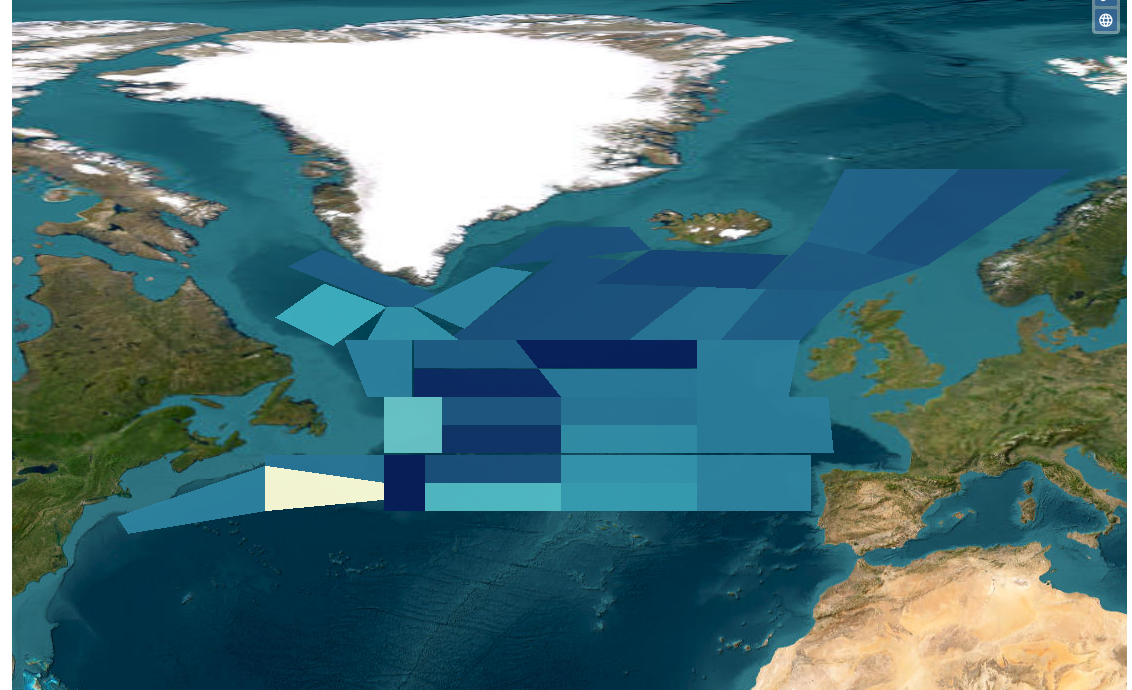
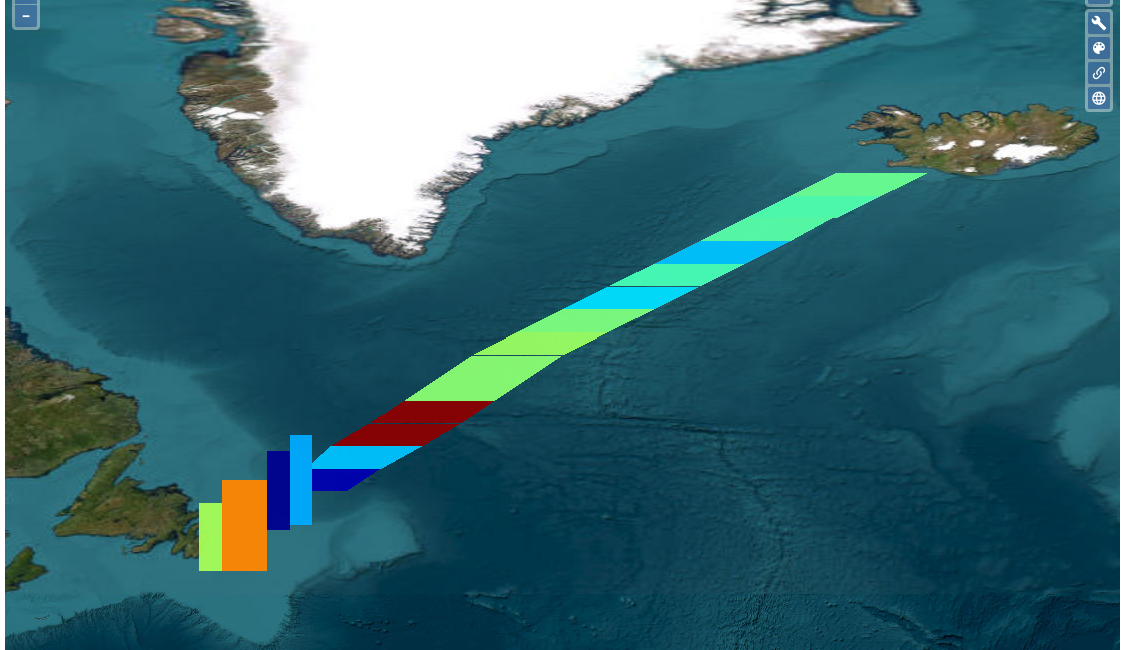
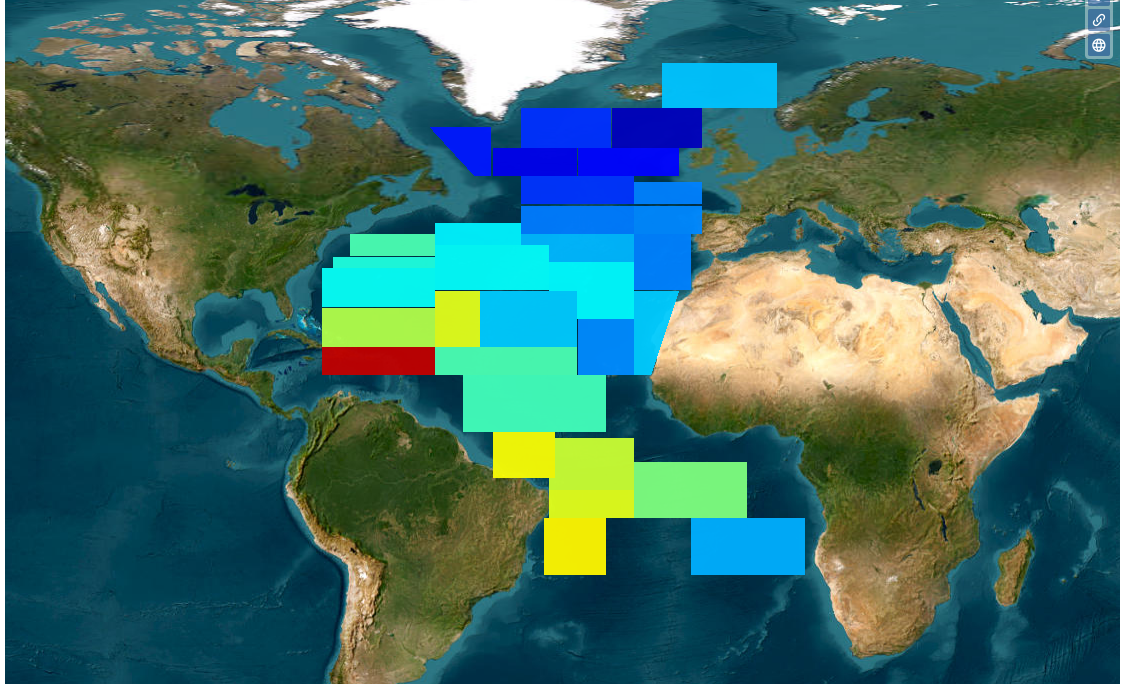
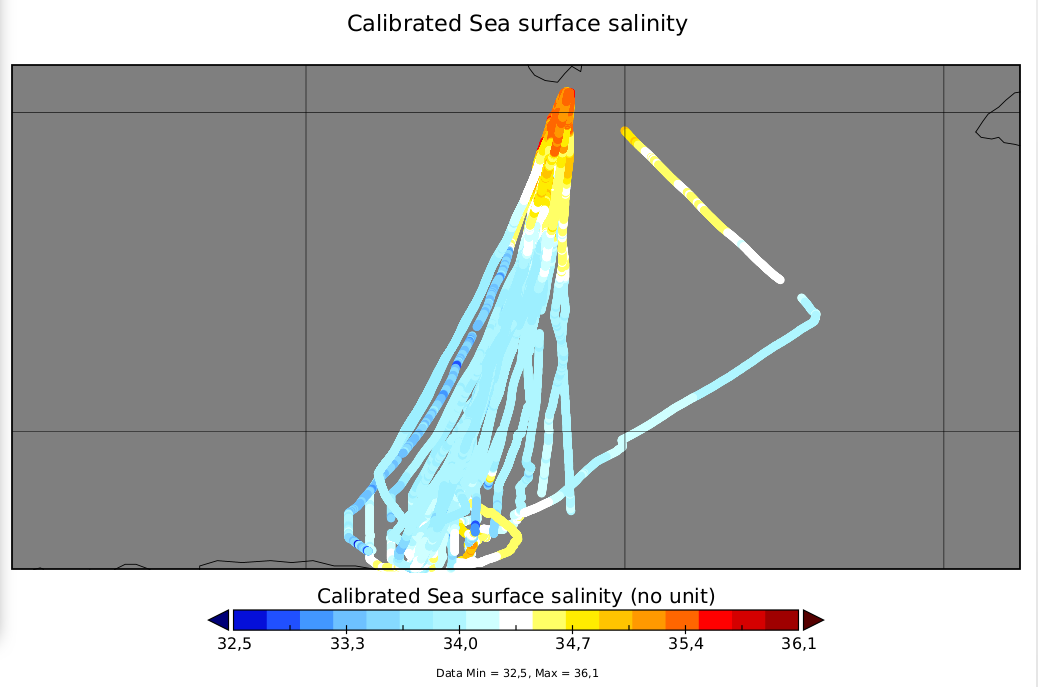
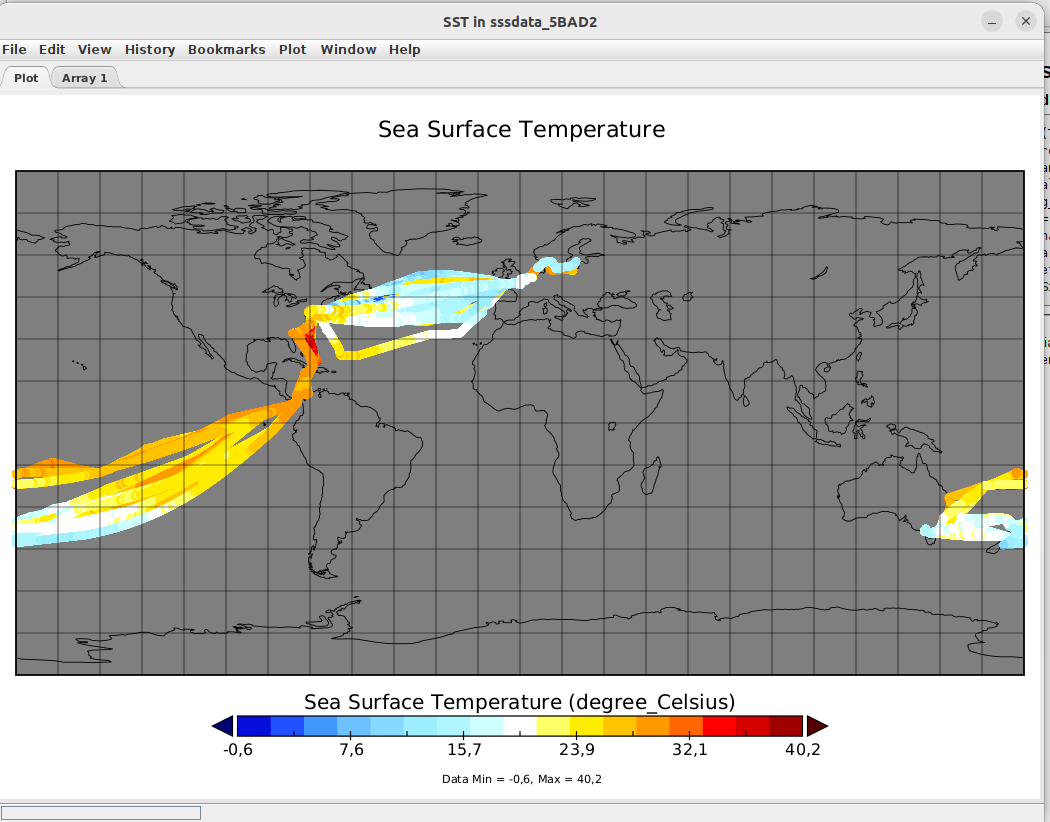
| CTOH | Couverture temporelle | Fichiers | Visu | Statut |
|---|---|---|---|---|
| Arctic and Antarctic sea ice thickness climate data record (ERS-1, ERS-2, Envisat, CryoSat-2) | 1994 – 2023 | ajour attributs compression 16 Nc | 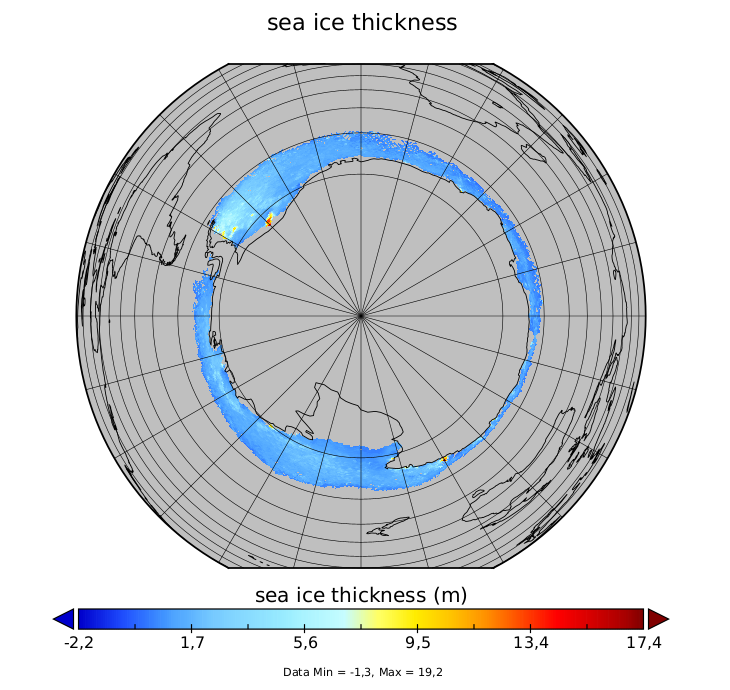 | Projection polaire |
| FES2014 altimetric corrections | 1992-2020 | 1 Nc | Nodes | |
| Inertial Currents | 1999-2006 | permute lon cor lon units 1 Nc | 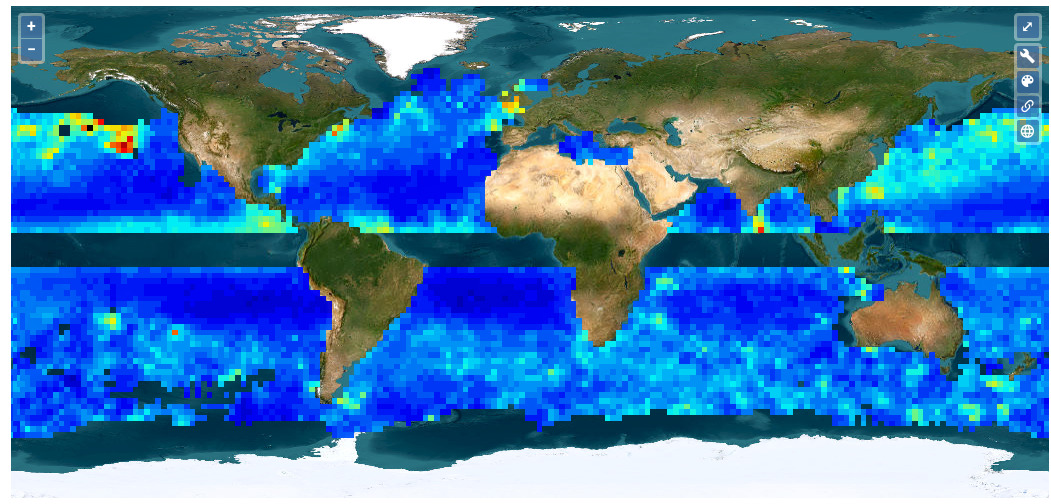 | |
| Sea-Ice Thickness North Hemisphere [Envisat] [CryoSat-2] [3] | 2002-2012 2010-2019 2002-2017 | compression 1 Nc |  | |
| Sea-Ice Thickness South Hemisphere from Altimetry (2003-2020) | 2003-2020 | HDF error à la compression 6 Nc | 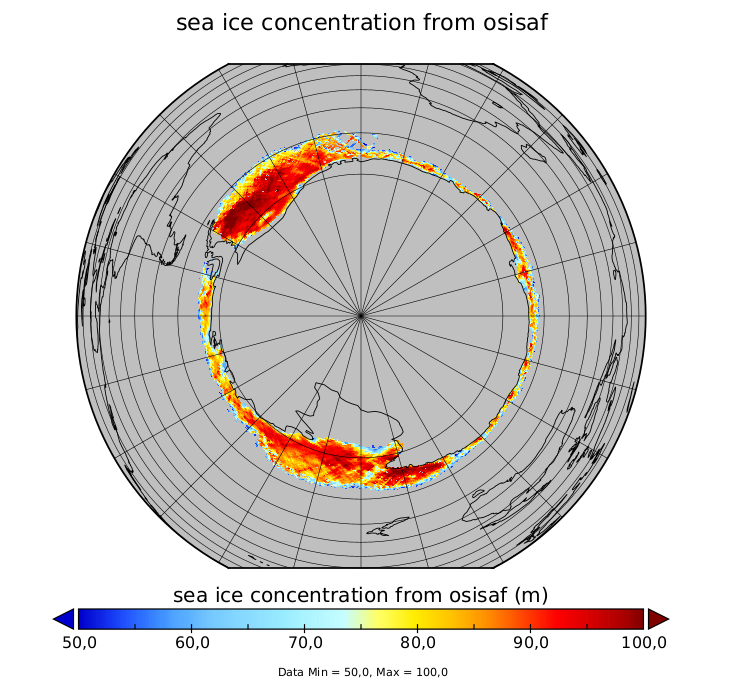 | Projection polaire |
| Southern Ocean Polar Fronts | 1993-2018 | 1 nc | ||
| X-TRACK, Along track Sea Level Anomalies [3] /Tidal Constants [2] (2015/2017/2018_01/02) [5] | 1995-2023 | GDR/nc |
| Autres projets | Couverture temporelle | Fichiers | Visu | Statut |
|---|---|---|---|---|
| SOCOA Suivi photographique de la Falaise de Socoa – 2010-07-13 / 2018-03-15 [20] | 2010 – 2018 | Regrouper les fiches ~ jpeg | 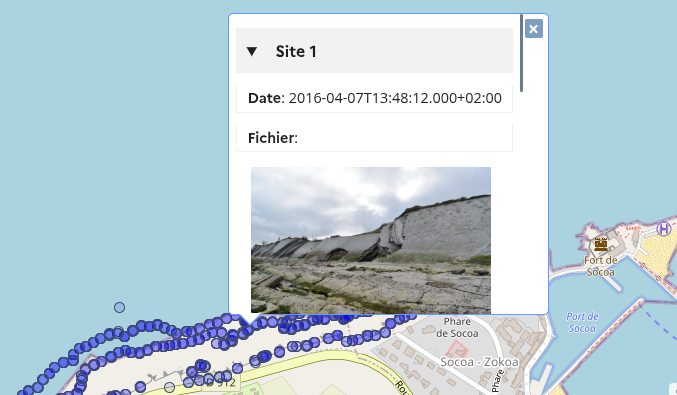 | |
| MOOSE 0-250 m ocean temperature, mooring line, Azur / Lion Buoy [2] | 2012 – 2021 | ASCII, JPG Lion : pas d’accés | 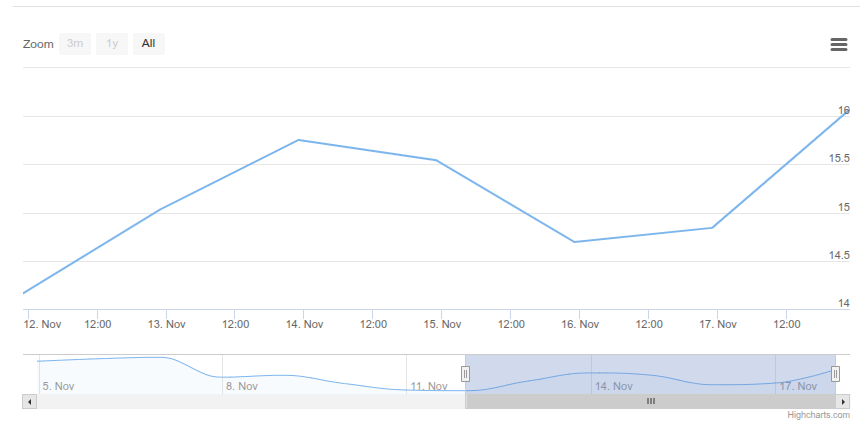 | Mettre au format Nc |
| SIROCCO FES2014 tidal atlas | – | Netcdf | Nodes | |
| THESIS Clustering and inundation maps based on CYGNSS reflectivity | 2018 – 2019 | double-> float permute time compress 2 nc files 9->1Go | 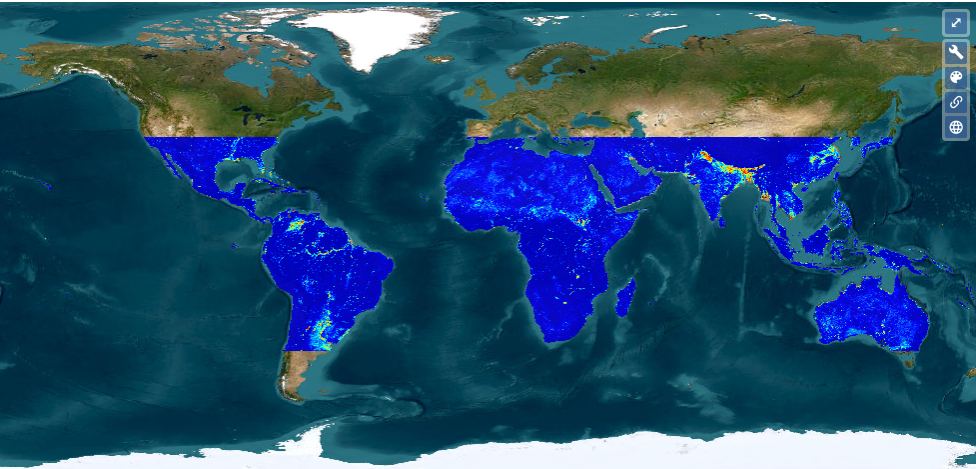 | |
| ZEBRE Mean vertical sections of zonal currents in the Tropical Pacific | 1998 – 2015 | ajout attribaux 5 nc | 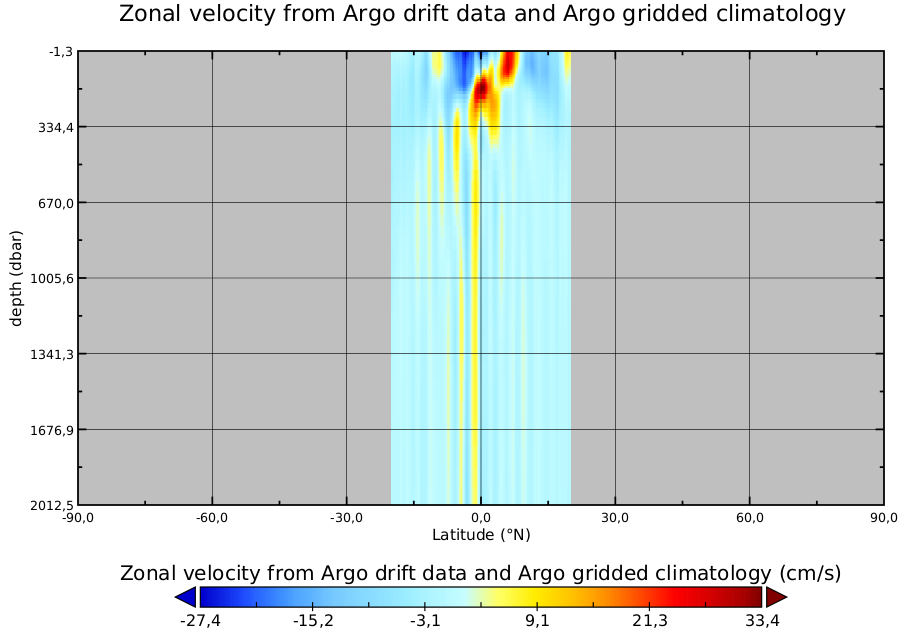 | A développer |
| SURVOSTRAL Vertical sections of in-situ temperature over 25 years in the Southern Ocean | 1992 – 2017 | compression ajout attribaux 3 Netcdf 58 Mo -> 1/3 | 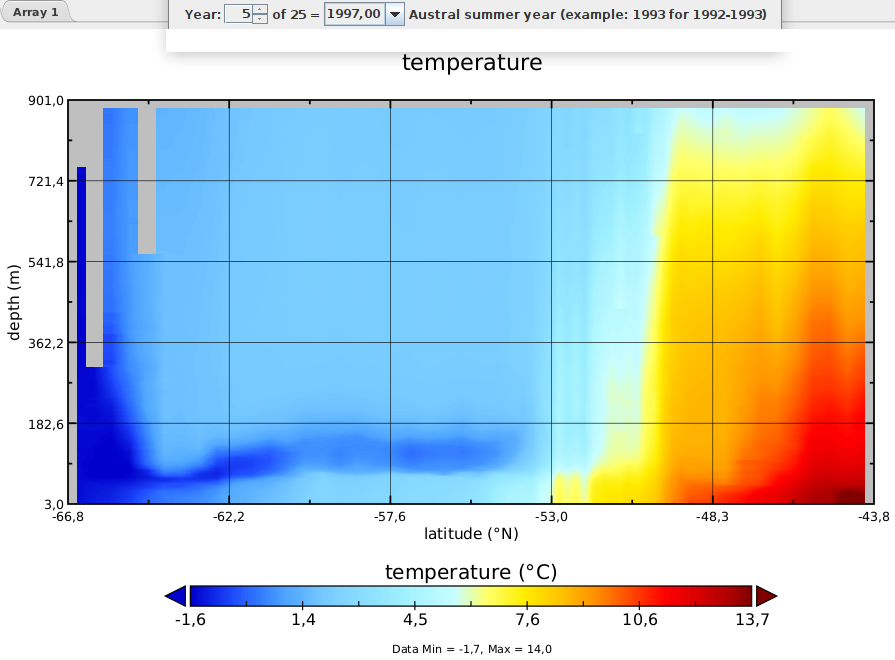 |
- Altimetric data of the Cryosat-2 mission GDR
- Altimetric normalized pass Netcdf – Formulaire soumis
| CTOH | Fichiers | Statut | Visu. |
|---|---|---|---|
| AlTiS products | |||
| AlTiS-NG Software | |||
| Altimetric data of the ERS-2 mission | |||
| Altimetric Backscattering | |||
| Altimetric data of the TOPEX mission | |||
| Hydrological surface monitoring and river discharge using multi-sensor satellite observations in the McKenzie Delta | |||
| Hydrological surface monitoring in the Inner Niger Delta | CSV | Restricted | |
| Water level monitoring in the Ogooué river basin | CSV | Restricted | |
| THEIA Accelerated global glacier mass loss in the early twenty-first century – Dataset. | tif | Mettre au format Nc |